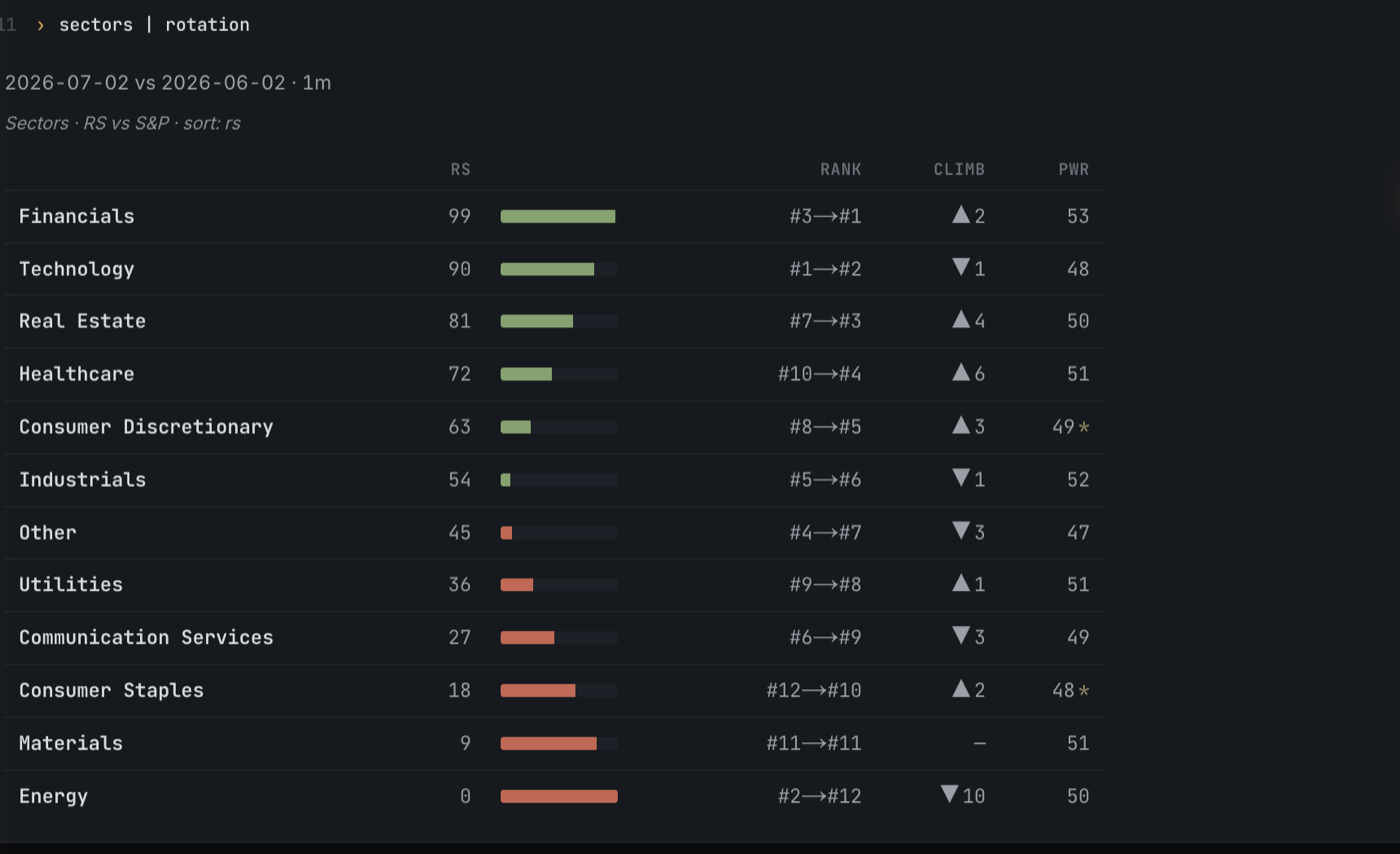
Concept
Sector Rotation
An index can drift sideways for weeks while leadership rotates underneath. Reading the rotation tells you where the setups will actually pay before everyone else gets the memo.
What is sector rotation?
Sector rotation is the practice of overweighting or underweighting parts of the stock market based on which sectors are leading right now and where the economy seems to be in its cycle. The premise is that different sectors lead at different phases: technology and consumer discretionary tend to lead a recovery, energy and materials tend to lead a late-cycle inflation peak, and consumer staples, health care, and utilities tend to hold up best in a downturn.
Sam Stovall popularized the textbook version of the idea at S&P Capital IQ. He divided the cycle into five stages (early, mid, and late expansion plus early and late recession) and mapped which sectors typically lead each. The framework rests on equities leading the real economy by roughly five months on the way up and seven months on the way down.
There is an honest caveat. Recent academic work (Molchanov and Stangl, 2024) shows that calendar-based sector rotation built on cycle phase produces little outperformance after transaction costs and after controlling for size, value, and momentum factors. The trader-useful version of sector rotation is not "guess the cycle phase". It is "follow what is already leading and avoid what is already lagging".
The 11 sectors and the cyclical-defensive split
The Global Industry Classification Standard (GICS) splits the US stock market into 11 sectors. Each has a SPDR sector ETF that traders use as a proxy: XLK, XLC, XLY, XLI, XLF, XLB, XLE, XLRE, XLP, XLV, XLU.
Cyclical / risk-on (seven sectors): Technology (XLK; software, semis, hardware) leads when growth expectations rise and rates fall. Communication Services (XLC; media, telecom, mega-cap internet like META and GOOGL) trades like growth-tech post-2018 GICS reshuffle. Consumer Discretionary (XLY; autos, retail, restaurants, travel) is the wallet-share bellwether. Industrials (XLI; machinery, defense, transports) tracks capex and global PMI. Financials (XLF; banks, insurers, brokers) is sensitive to the yield curve and credit spreads. Materials (XLB; chemicals, metals, packaging) follows inflation and the China cycle. Real Estate (XLRE; REITs) is rate-sensitive (cyclical on yields, defensive on rents).
Defensive / risk-off (three sectors): Consumer Staples (XLP; food, beverages, tobacco, household) has inelastic demand. Health Care (XLV; pharma, devices, payers) is relatively cycle-independent but policy-sensitive. Utilities (XLU; power, gas, water) is a bond proxy that outperforms when yields fall.
Energy (XLE) is the classification oddball. MSCI's formal scheme labels it defensive (low correlation with growth), but most retail traders treat it as cyclical because it is commodity-driven and tends to lead at the late-cycle inflation peak. In practice you read energy alongside cyclicals.
How swing traders read rotation in practice
Sector RS lines. Each sector ETF plotted as a ratio against SPY. A rising line means the sector is outperforming. StockCharts and TradingView show this directly. The simplest read: which lines are rising, which are falling, which just turned.
Ratio charts. Pairwise: XLY divided by XLP is the canonical risk-on / risk-off gauge. XLK divided by XLE captures growth-versus-commodity regime. XLF divided by XLU captures cyclical-versus-bond-proxy. When XLY:XLP is rising, traders are paying up for cyclicals. When XLY:XLP is falling, capital is rotating toward staples.
IBD Industry Group rankings. IBD ranks 197 industry groups by 6-month price performance. The top 20 is the working hunting ground for CANSLIM-style traders. O'Neil's rule: roughly half of a stock's move comes from its group, so buy the leading stock in a leading industry.
How the schools weight sector rotation in their setups. Mark Minervini's SEPA explicitly demands the stock's industry group be in a Stage 2 advance. Stan Weinstein's rule: never buy a Stage 2 stock if its sector is in Stage 4. Kristjan Kullamägi (Qullamaggie) treats the leading sector as a force multiplier; he hunts breakouts and episodic pivots inside the strongest groups and ignores laggards. Three different traders, one rule: the sector tailwind matters.
Indicators that flag rotation early
Defensive bid. XLU, XLP, and XLV outperforming SPY without an obvious news catalyst is a regime warning. It often shows up one to three months before the broad index actually rolls over.
Credit cyclicals. XLF and KRE (regional banks) relative to SPY. KRE is the more sensitive read: regional banks reflect loan demand, deposit flows, and yield-curve shape. Regional bank underperformance with a flattening yield curve is the textbook late-cycle warning.
Sector advance-decline lines. Net advancers minus decliners inside each sector. Tech A/D rolling over while Utility A/D rises is rotation in real time, often visible before the cap-weighted index tells you anything.
Sector new-high counts. The number of stocks in each sector hitting 52-week highs. Persistent leadership shows up as sustained 20%+ of a sector at new highs. Broken leadership shows up as the count collapsing while the ETF still drifts up on mega-cap weight.
Six rotation examples worth studying
2000-2003: Dot-com bust to defensives and value. The Nasdaq fell 78% from March 2000 to October 2002 while Consumer Staples returned roughly 11% annualized, Utilities held positive, and Energy ran on a crude move from $20 to $35+. The textbook example of defensive leadership during a tech-led drawdown.
2003-2007: Financials, materials, housing lead. With the Fed cutting from 6.5% to 1% by mid-2003, Financials, Real Estate, and Materials/Energy led a five-year run while Tech lagged badly. Commodity supercycle plus the housing and credit boom did the heavy lifting until they cracked.
2008: Defensives only. During the Global Financial Crisis drawdown, Staples, Health Care, and Utilities held up best in relative terms. XLF lost ~55%, XLE ~35%, while XLP fell ~15%. Classic recession-quadrant behavior.
2009-2021: Growth-tech secular run. Post-GFC zero-interest-rate policy plus the FAANG (later Magnificent Seven) earnings juggernaut produced 12-plus years of growth and tech leadership. Brief value flares (2013, late 2016) never sustained.
2022: Energy and value lead. Inflation shock and Fed hiking cycle. S&P 500 -19.4%, Nasdaq -33%, Magnificent Seven -41%, while XLE returned over +60%. Pure late-cycle inflation rotation, exactly what Stovall would have called.
2023-2024: Magnificent Seven, then broadening. The seven mega-caps drove ~62% of the S&P 500's 26.3% return in 2023. By mid-2024 their share dropped toward 40% as Financials, Industrials, and Health Care joined. The textbook breadth thrust setup that often precedes durable bull market continuation.
Where the rotation lens fails
Lagging versus leading. By the time a sector tops the year-to-date leaderboard, the move is partly priced in. Best entries come during the transition (when the sector RS line is just turning up), not after sustained outperformance.
Sector classification noise. Tesla classified as Consumer Discretionary instead of Tech surprised many in 2020-2022. Amazon was Consumer Discretionary until the 2018 GICS reshuffle. GOOGL and META live in Communication Services despite being ad-tech businesses. The label does not always match how a stock actually trades.
Mega-cap concentration. XLK is roughly 39% NVDA, AAPL, and MSFT combined. XLC is about 45% META and GOOGL. XLY is about 40% AMZN and TSLA. The ETF can mask weakness in the rest of the sector. Equal-weight cousins like RYT and RSPT often diverge meaningfully.
ETF flows distort price. Index inclusion buying, sector-ETF rebalancing, and quarter-end positioning can move sector ratios for non-fundamental reasons that mean nothing to a swing trader.
How TickerStance reads sector rotation
The Leadership subscore weights five signals into a single 0-to-100 score. Sector RS (the share of US sectors beating SPY over a rolling window) is the anchor at 40% weight, with 30% beating = narrow regime and 70% beating = broad participation. Small versus large (IWM minus SPY 60-day spread, 20%) and growth versus broad (QQQ minus SPY, 15%) refine the read. Cyclicals minus defensives (15%) and equal-weight versus cap-weight (10%) round it out.
The point is not to predict which sector must lead next. The point is to show whether leadership is broadening, narrowing, or shifting toward defensive areas, so you can decide whether to press, pause, or step back. The dashboard sector heatmap surfaces the rotation in real time, and the Leadership subscore feeds the headline Stance score so a defensive rotation actually drags the regime read down.
Frequently asked questions
What is sector rotation?
Sector rotation is the shift of capital between stock-market sectors as economic conditions and risk appetite change. Different sectors lead at different stages of the business cycle, and tracking the rotation tells swing traders where setups have the best base rates.
What are the 11 stock-market sectors?
Technology, Communication Services, Consumer Discretionary, Industrials, Financials, Materials, Energy, Real Estate, Consumer Staples, Health Care, and Utilities. The grouping is defined by the GICS classification used by every major US sector ETF (XLK, XLC, XLY, XLI, XLF, XLB, XLE, XLRE, XLP, XLV, XLU).
Which sectors are cyclical and which are defensive?
Cyclical sectors (Technology, Discretionary, Industrials, Financials, Materials, Real Estate, Communication Services) track the economy and lead in expansions. Defensive sectors (Staples, Health Care, Utilities) hold up better in downturns because their demand is less sensitive to the cycle.
Which sectors do best in a recession?
Consumer Staples, Health Care, and Utilities historically outperform during recessions because demand for food, medicine, and electricity stays relatively steady regardless of the economy. They are the textbook defensive trio.
Which sectors lead an early-cycle recovery?
Consumer Discretionary, Financials, Real Estate, and Industrials typically lead early in an expansion as consumers and businesses borrow and spend again. Technology often joins shortly after as growth expectations recover and rates stay supportive.
What is the XLY:XLP ratio and why do traders watch it?
XLY divided by XLP is the canonical risk-on / risk-off gauge: Consumer Discretionary over Consumer Staples. A rising ratio means traders are paying up for cyclicals and risk appetite is healthy. A falling ratio means capital is rotating defensive, which is often an early warning of broader weakness.
How do swing traders use sector rotation?
They hunt setups inside the strongest sectors because most of a stock's gain comes from its industry group, and they avoid breakouts in lagging sectors with low base rates. Mark Minervini and Kristjan Kullamägi both demand the sector be in Stage 2 before they trade individual names in it.
Is sector rotation real or just a myth?
Calendar-based rotation built on cycle phase has weak academic support after costs (Molchanov and Stangl, 2024). But tactical rotation based on observed relative-strength leadership is well-documented and remains useful for swing traders. Follow what is leading, do not predict what should lead.
Why do XLK and XLC move so closely with a few stocks?
Because of mega-cap concentration. XLK is roughly 39% NVDA, AAPL, and MSFT combined. XLC is about 45% META and GOOGL. The ETF largely reflects those handful of names, so the rest of the sector can diverge meaningfully. Equal-weight ETFs like RSPT and RSPC can show what the average sector stock is doing.
What is a defensive bid?
A defensive bid is when Utilities, Staples, and Health Care quietly outperform without obvious news. Institutions are de-risking before broader weakness shows up in the indexes. It is one of the earliest regime warnings, often visible one to three months before a correction begins.
Related reading